Monday, March 20, 2017

THE GROUP MEMBERS


GROUP PICTURE. HAHAHA!


GROUP 1 ABM-B

  MEMBERS:


HERZLIA JANE RAMOS BARANGAN
NOVA JANE TORO 
NAOMI APUGAN
JOVELLIE AGBAYANI 
ROMELIE LAGANA
HANZ BRIAN MUEGO


LESSON 7

BASIC PRINCIPLES OF WEB GRAPHICS AND LAY-OUT


  • BALANCE- The visual weight of objects, textures, colors, and space is evenly distributed on the screen.
  • EMPHASIS - An area in the design that may appear different in size, texture, shape or color to attract the viewer's attention.
  • MOVEMENT - Visual elements guide the viewer's eyes around the screen.
  • PATTERN AND REPETITION - These are the repeating visual element on an image or lay-out to create unity in the lay-out or image.
  • RHYTHM - is achieved when visual elements create a sense of organized movement.
  • PROPORTION - Visual elements create a sense of unity where they relate well with one another.
  • VARIETY - This uses several design elements to draw a viewer's attention.


BLOGGING ETHICS


  • ACCOUNTABILITY - Authors must be accountable on whatever they write on their blogs. Accountability means holding responsibilities to high standards of performance, the goal is to produce the best content with our readers' interest in mind. They are, after all, the only reason we write.
  • ACCURACY - As a content creator, educator, news relayed, information slayer, your job as a blogger is to give your readers the most accurate information - identifying your sources, checking facts, never sacrificing accuracy and fairness for the sake of a "good" study. This includes citing and attributing everything you've used, read and referenced when writing a post.
  • INDEPENDENCE - means freedom from outside control or support, a blogger can write anything he or she wants to share without having someone saying he/she must do.
  • TONE - bloggers must write with their intended audience in mind. The key to successful blogging is alignment of interests between writer and reader. It's that sweet spot where what's good for your readers matches what's good for you. Don't focus on having a great blog. Focus on producing a blog that's great for your readers.

LESSON 6: IMAGING & DESIGN FOR ONLINE ENVIRONMENT


PHOTO EDITING
·         Photo editing encompasses the processes of altering images, whether they are digital photographs, traditional photo chemical photographs, or illustrations. Traditional analog image editing is known as photo retouching, using tools such as an airbrush to modify photographs, or editing illustrations with any traditional art medium.
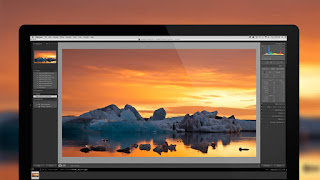


Graphic software programs
·         Which can be broadly grouped into vector graphics editors, raster graphics editors, and 3D modelers are the primary tools with which a user may manipulate, enhance, and transform images. Many image editing programs are also used to render or create computer art from scratch.

BASIC OF IMAGE EDITING

1. RASTER IMAGES are stored in a computer in the form of a grid of picture elements or pixels.
2. VECTOR IMAGES such as Adobe Illustrator, Inkscape and etc. are used to create and modify vector images, which are stored as descriptions of lines, Bezier curves and text instead of pixels.

DIFFERENCE BETWEEN RASTER AND VECTOR IMAGES
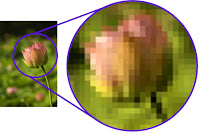


· RASTER IMAGES use many colored pixels or individual building blocks to form a complete image JPEGs, GIFs and PNGs are common raster image types. Almost all of the photos found on the web and in print catalogs are raster images.
·         VECTOR IMAGES alternatively, allow for more flexibility. Constructed using mathematical formulas rather than individual colored blocks, vector file types such as EPS, AI and PDF are excellent for creating graphics that frequently require resizing.

3. 3D MODELING (OR MODELLING) is the process of developing a mathematical representation of any three dimensional surface of an object via specialized software. The product is called a 3D model. It can be displayed as a two-dimensional image through a process called 3D rendering or used in a computer simulation or physical phenomena. The model can also be physically created using 3D printing devices.


IMAGE FORMATS
Ø  JPEG is a commonly used method of lossy compression for digital images, particularly for those images produced by a digital photography.
Ø  PNG (PORTABLE NETWORK GRAPHICS) is a raster graphics file format that supports lossless data compression.
Ø  GIF a lossless format for image files that supports both animated and static images.
Ø  BMP is a raster graphics image used to store bitmap digital images
Ø  EPS used in vector-based images in Adobe Illustrator.
Ø  SVG is an XML-based vector image format for two-dimensional graphics w/ support for interactivity and animation
Ø  .3ds is one of the file formats used by the Autodesk 3Ds Max 3D Modelling, animation and rendering software.
Ø  .fbx is an exchange format, in particular for interoperability between Autodesk products and other digital content creation software

FEATURES OF IMAGE EDITORS

SELECTION One of the prerequisites for many of the app mentioned below is a method of selecting part(s) of an image, thus applying a change selectively without affecting the entire picture
Ø  MARQUEE TOOL for selecting rectangular or other regular polygon-shaped regions
Ø  LASSO TOOL for freehand selection of a region
Ø  MAGIC WAND TOOL selects objects or regions in the image defined by proximity of color or luminance


LAYERS which are analogous to sheets of transparent acetate, stacked on top of each other, each capable of being individually positioned, altered and blended with the layers below, w/o affecting any of the elements on the other layers.


IMAGE SIZE resize images in a process often called image scaling, making them larger, or smaller. High image resolution cameras can produce large images which are often reduced in size for Internet use.
CROPPING creates a new image by selecting a desired rectangular portion from the image being cropped. The unwanted part of the image is discarded. Image cropping does not reduce the resolution of the area cropped.


CLONING uses the current brush to copy from an image or pattern. It has many uses: one of the most important is to repair problem areas in digital photos.
IMAGE ORIENTATION - Image editors are capable of altering an image to be rotated in any direction and to any degree. Mirror images can be created and images can be horizontally flipped or vertically flopped. Rotated image usually require cropping afterwards, in order to remove the resulting gaps at the image edges.


PERSPECTIVE - is the art of drawing solid objects on a two- dimensional surface so as to give the right impression of their height, width, depth and position in relation to each other when viewed from a particular point.


SHARPENING AND SOFTENING Sharpening makes images clearer. Too much sharpening causes grains on the surface of the image. Softening makes images softer that removes some of the highly visible flaws. Too much causes the image to blur.


SATURATION- is an expression for the relative bandwidth of the visible output from a light source. As saturation increase, colors appear more “pure.’’ As saturation decreases, colors appear more ‘’ washed-out.’’


CONTRAST AND BRIGHTENING
Contrast of images and brighten or darken the image. Underexposed images can be often be improved by using this feature.
Brightening lightens the image so the photo brightens up. Brightness is a relative expression of the intensity of the energy output of a visible light source.
Adjusting contrast means adjusting brightness because they work together to make a better image.


PHOTO MANIPULATION
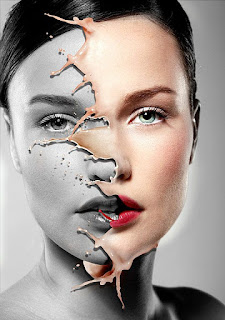
Photo manipulation involves transforming or altering a photograph using various methods and techniques to achieve desired results. Some photo manipulations are considered skillful artwork while others are frowned upon as unethical practices, especially when used to deceive the public, such as hat used for political propaganda , or to make a product or person look better.


DIFFERENCES

PHOTO EDITING – signifies the regular process used to enhance photos and to create them ‘’Actual editing simple process’’. Also includes some of the regular programs used for editing and expose how to use them.

PHOTO MANIPULATION – includes all simple editing techniques and have some manipulation techniques like erasing, adding objects , adding some graphical effects, background correction, creating incredible effect, change elements in an image,  adding styles , eliminating blemishes from a  person’s face and changing the features of a person’s body.


b.) Infographics
 also known as data visualization, information design, and communication design

·         It is any graphic that display and explains information, whether that be data or words. When we use the term ‘’infographics’’, we’re using it as a general term used to describe data presented in a visual way.
·         Infographics are important because they change the way people find and experience stories. Infographics are being used to augment editorial content on the web, it create a new way of seeing the world of data, and they help communicate complex ideas in a clear and beautiful way.


TYPES OF INFOGRAPHICS
1.       Statistical
2.       Process Flow
3.       Geographic


PROCESS OF MAKING INFOGRAPHICS
1.       Research
a)      Know what is needed
b)      Take a reference
c)       Know the audience
d)      Decide the type of infographics
2.       Brainstorm
a)      Gather ideas
b)      Build thought process
3.       Design
                             a)    Choose your tool and start designing
4.       Review
                             a)     Cross check the data to deliver flawless output
5.       Launch
                             a)    Make it viral
                             b)    Share on social network


BEST PRACTICES WHEN CREATING INFOGRAPHICS
a)      Maintain a structure
b)      Don’t use more than 3 color palletes
c)       Typography matters a lot
d)      Include source and references


LESSON 5 & 6: ADVANCED SPREADSHEET AND PRESENTATION SKILLS

MICROSOFT EXCEL FORMULAS AND FUNCTIONS

Three types of information can be typed into a spreadsheet cell

1. LABELS
 Text entries
Identify values in columns and rows
Left-aligned
Type an apostrophe (‘) before a number to treat the number like a label.
EX.
‘2007
‘402-6900
2. VALUES
Numbers
To be used in calculations
Right-aligned
#### Size the cell larger
#### appears if the number is too larger for the size of the cell

3. FORMULAS
Used to perform calculations
Begin with = sign
Type the cell address that contain the values you want to calculate.


ARITHMETIC
OPERATOR
DEFINITION
EXAMPLE OF USAGE
MEANING

  +

              
                -


                *

              
                /


  ^

Addition


Subtract


Multiplication


Division


Exponentiation

=B3+C3


=F12-22


=A3*B3


=C3/C6


=C12^6

Add the value in B3 and the value in C3

Subtract 22 from the contents of cell F12

Multiply the value in cell A3 by the value in cell B3

Divide the contents of cell C3 by the contents of cell

Raise the value in cell C12 to the sixth power

COMMON FUNCTIONS/FORMULAS
·         SUM
§  Calculates the sum of a range of cells
·         MAX
§  Displays the largest value in a range of cells
·         MIN
§  Displays the smallest value in a range of cells
·         COUNT
§  Calculates the number of values in a range of cells
·         AVERAGE
§  Calculates the average of values in arrange of cells
CELL REFERENCES
ü  Always use cell references in formulas. A cell reference in the column letter and the row number.

Why?

·         By using it in the formula, you can use the powerful recalculation feature in Excel.
  • If you change the contents of a cell that is included in a formula, the worksheet will automatically recalculate it.
 PRESENTATION SOFTWARE


Quick tips in creating effective presentation
·        
      Minimize- Keep slide count to a minimum to maintain a clear message and to keep the audience attentive. Remember that the presentation is just a visual aid. Most info should still come from the reporter.
·         Clarity- Avoid being fancy by using a font style that is easy to read. Make sure that it is also big enough to read by the audience.
·         Simplicity- Use bullets or short sentences. Summarize the information on the screen to have your audience focus on what the speaker is saying than on reading the slide.
·         Visuals-Use graphics to help your presentation but not too many to distract the audience in addition, instead of using table of data. Use charts and graphs.
·         Consistency- Make your design uniform. Avoid having different font styles and background.
·         Contrast- Use light font on dark background or vice versa. This is done because it is easier to read on the screen.


LESSON 4: TEXT AND IMAGE WRAPPING


TYPES OF PRODUCTIVITY TOOLS

WORD PROCESSING
·         


      Helps people to create attractive &  effective business documents
·         Provides an easy way to edit and enter text
ü  Checks spelling and grammar
ü  Can add graphics with ease
  • ·         Also known as a document preparation system
  • ·         A program where you can type and print documents
  • ·         Replaced old typewriters


APPLICATION AREAS OF WORD PROCESS
  •   BUSINESS- Legal copies, letterheads, letters, memos circulars etc.
  • EDUCATION- to develop word processing skills from the very beginning
  • HOME- Dealing w/ assignments being completed at home or occasionally recreational


·     ADVANTAGES


1.      Faster                                   
2.      Can edit documents
3.      Change font style, size, colour
4.      Change layout                          
5.      Print many copies
6.      Less noise
7.      Add pictures
8.      Make tables
9.      Email documents

·            DISADVANTAGES


        1.      Equipment costs
        2.      Upgrade software
        3.      Train staff
        4.      More complicated
        5.      Virus, pop-up


SPREADSHEETS


  •  Allows users to analyze numeric and financial data
  •  The ability to enter complex formulas and have the computer automatically calculate it.
  •    Can be used to make graphs and charts
  •     Provides a structured way to look at things (organizational tool)
PRESENTATION SOFTWARE


  •          Ideal way to communicate ideas to a group of people
ü  Used by businesses, students, researchers
ü  Provides  a speaker with a visual aid to guide a presentation

DATABASE SOFTWARE


 Managing information has become the most valuable ability of a computer
ü  Websites depend on databases to deliver important info to visitors
ü  Can be used to track and analyze stocks and bonds
ü  Analyze weather data to make forecasts
PERSONAL INFORMATION MANAGEMENT SOFTWARE


·         Examples are Microsoft outlook and Google Calendar
            Helps individuals organize themselves

ü  Set-up to do lists
ü  Manage contact lists
ü  Act as an appointment calendar

MOBILE SOFTWARE


·         Apps made for smartphones
·         Allows people to manage calendars and receive emails while away from their desk
·         There is also web-delivered services
ü  Popular ones are YouTube , Google Maps and FB

RICH INTERNET APPLICATIONS
·       


            Software that is available online, often for free
·         Faster internet capabilities along with advancements with web technologies and cloud computing gave rise to RIAs

SUITES


·         Packages of productivity software
·         Usually includes
      ü  Word processor
      ü  Spreadsheet
      ü  Presentation software
      ü  Personal info management software


MICROSOFT OFFICE is the most popular and widely used form of productivity software. It includes:


1.      Microsoft Word
2.      Excel
3.      PowerPoint
4.      OneNote
5.      Outlook
6.      Publisher
OTHER COMPANIES - Competitors to Microsoft include:
  • ·         Corel WordPerfect Office
  • ·         IBM Lotus SmartSuite
  • ·         Apple iWork
  • ·         Sun Microsystems Star Office
  • ·         OpenOffice.org

  Business Effects of using productivity tools
v  Enhances performance of employees
v  Easy to use
v  Provides a common format

TEXT and IMAGE WRAPPING: Text wrapping options


1.  In-line wrapping - Doesn’t give you much control. You can’t add a border.
2.  Square wrapping - Gives you much more control. You can add a border and effects and drag the image.
3.  Tight wrapping - The text sits nearer the image. You can add a border & effects, and drag the image.
4.  Behind text wrapping - Useful if you want to put a watermark on a page or in a table.
5.  In front of text wrapping – Text underneath the image is visible.
6.  Through wrapping – Similar to tight but if there are any blank spaces at the sides of the image, text will flow into those areas. Best used in PNG images.
7.  Top & bottom wrapping – This is the one used most often in books. The image breaks up lines of text not just paragraphs, so you may have to nudge it up or down so it sits between paragraphs.